Published: 2021-08-30
Building a Home-made Hydrogen Line Telescope
Many years ago I was browsing the Internet idly when I came across a Poster titled ‘A low-cost 21 cm horn-antenna radio telescope for education and outreach’, and I very quickly fell in love with the idea of amateur radio astronomy
That one poster led me on a years long project to build my own radio telescope which I recently took out on its first 24-hour drift scan!
This is not a guide to build your own telescope, although I will link to plenty of those.
This article is a collection of notes about my telescope and its operations that I hope others might find useful if they want to build their own. I will also include a few pointers to help bridge missing-links that I bumped into along the way in the hopes of smoothing the path for future travellers.
Why Build a Radio Telescope?
Short Answer: Because is it freaking awesome!
The longer answer is I had been playing with SDRs for many years before diving into the world of radio astronomy, and a radio telescope was the perfect stretch-project. It had enough overlap with areas I was familiar with (radios, data processing, maths) and enough areas to keep it novel, challenging and interesting (antenna engineering, astronomical coordinates, physics).
It is also a great teacher of patience, having spent my life mostly building software with mostly instant feedback and gratification it has been good to have a hobby that forces me to wait (for parts, for the weather, for results).
My Telescope
Modelled after the design in the poster my telescope is a pyramidal horn antenna measuring 80cm at it’s longest width, and over 1.8 meters tall. It is mostly made out of cardboard, Aluminum foil and Aluminium tape, with the exception of the wave guide which features a galvanized steel wire soldered to an N-type connector.
This feeds directly into another N-type which adapts to SMA, to which is connected an LNA designed specifically for Hydrogen line radio astronomyNooelec SAWbird+ H1 which is powered by an SDR via bias-t, connected to a Raspberry Pi.
All together, including the Raspberry Pi, the telescope is built from materials costing less than $200 CAD.
The Raspberry Pi runs rtl_power which integrates the
signal over a long period of time (typically 60s-120s) and stores the
recently power level readings to file.
I then have a custom software suite which processes these files to calibrate the readings and generate graphs, charts and spectrum plots.
Signal Processing and Calibration
The Hydrogen Line is a very ubiquitous, but weak, signal. The reason the telescope integrates across minutes is that the actual signal is below the noise floor, and it takes many averages to lower the noise enough to detect it.
This makes calibration of the telescope, and it’s receiver, vitally important. There are many schools of thought on calibration, but I will quickly mention 2 here:
- Sample the signal twice at two different centre frequencies which
are then aligned and subtracted to remove the background ripple.See:
21cm (1420MHz)
Amateur Radio Astronomy.
- Normalize every reading to a designated “calibration” reading.
For now my software does the second option, finding the quietest reading across all observations and using that as the nominal calibration frequency. All signals are then normalized in terms of the calibration observation which causes any generalized baseband response to cancel out, leaving only the signal.
This process is not ideal. It relies on the assumption of both a quiet radio sky, and a fairly static baseband response over time. In the future I would like to upgrade my receiving software to better take advantage of the processing power of the Raspberry Pi and likely implement a variant of the first process.
First Attempts
The telescope described above wasn’t my first telescope. I first built a much smaller version to fit into an apartment building I was living in at the time. Even then it was pretty hard to move around, and I had limited sky space to point it at.
The receiving system was much more complex, featuring two general purpose LNAs and two bandpass filters along the design of the telescope in the inspirational poster. It also featured a much more clumsy waveguide and feed line, and required some acrobatics of external power management to work the whole thing.
All in all I only managed to get the telescope “working” a handful of times and could never have it setup for very long without it getting in the way. It was eventually destroyed in the aftermath of massive flooding in the building.
That first build taught me a lot though, mostly about the importance of good feedline construction, why you should use DC-blocks when power RF-components externally, and that you can get glimpses of the hydrogen line even from a tiny city apartment.
The Astronomy Side
It is impossible to do hobby radio astronomy without getting exposed to the “astronomy” part, although this is very much a choose-your-own-adventure as far as how deep you want to go.
I am not a professional astronomer, and my last physics course was well over a decade ago, so take all the advice here with a pinch of salt.
There are the obvious things to learn like “what is the hydrogen line?” and “where is the galactic plane?”. There are also practical toolsyou will want to pick up like converting azimuth-altitude to equatorial or galactic coordinates, and there are the much deeper theoretical aspects like measuring galactic rotation curves.
Personally I really wanted to get into the nuts-and-bolts so I chose the hard route of writing all my software from scratch, so I could understand the various intricacies of time and co-ordinate systems that I was dealing with. You could if you wanted load up astropy or some other library and input some number and get on with your life if that is not where your interests are, but I would recommend at least running through some calculations yourself to understand what the numbers mean and where they come from.
There isn’t a single reference here I can recommend. I dove through tens of books and hundreds of papers and manuals one of them were ever quite complete.
I do recommend downloading a copy of the HIPPARCOS data and playing around with it. Try plotting the stars in different co-ordinate systems and calculating which stars are over your head at a given time.
I think HIPPARCOS is a great place to start because the catalogue is small enough to be easily manageable but will require some programming to really dive into. It also comes with extensive documentation that will lead you to other source and other concepts, and after playing with it you will have a good sense of most of the astronomical concepts necessary to grapple with the basics.
There are also plenty of other projects to do with the data (such as reproducing the Hertzsprung–Russell diagram of stellar classifications) - unrelated to the hydrogen line.
My First 24hour Drift Scan
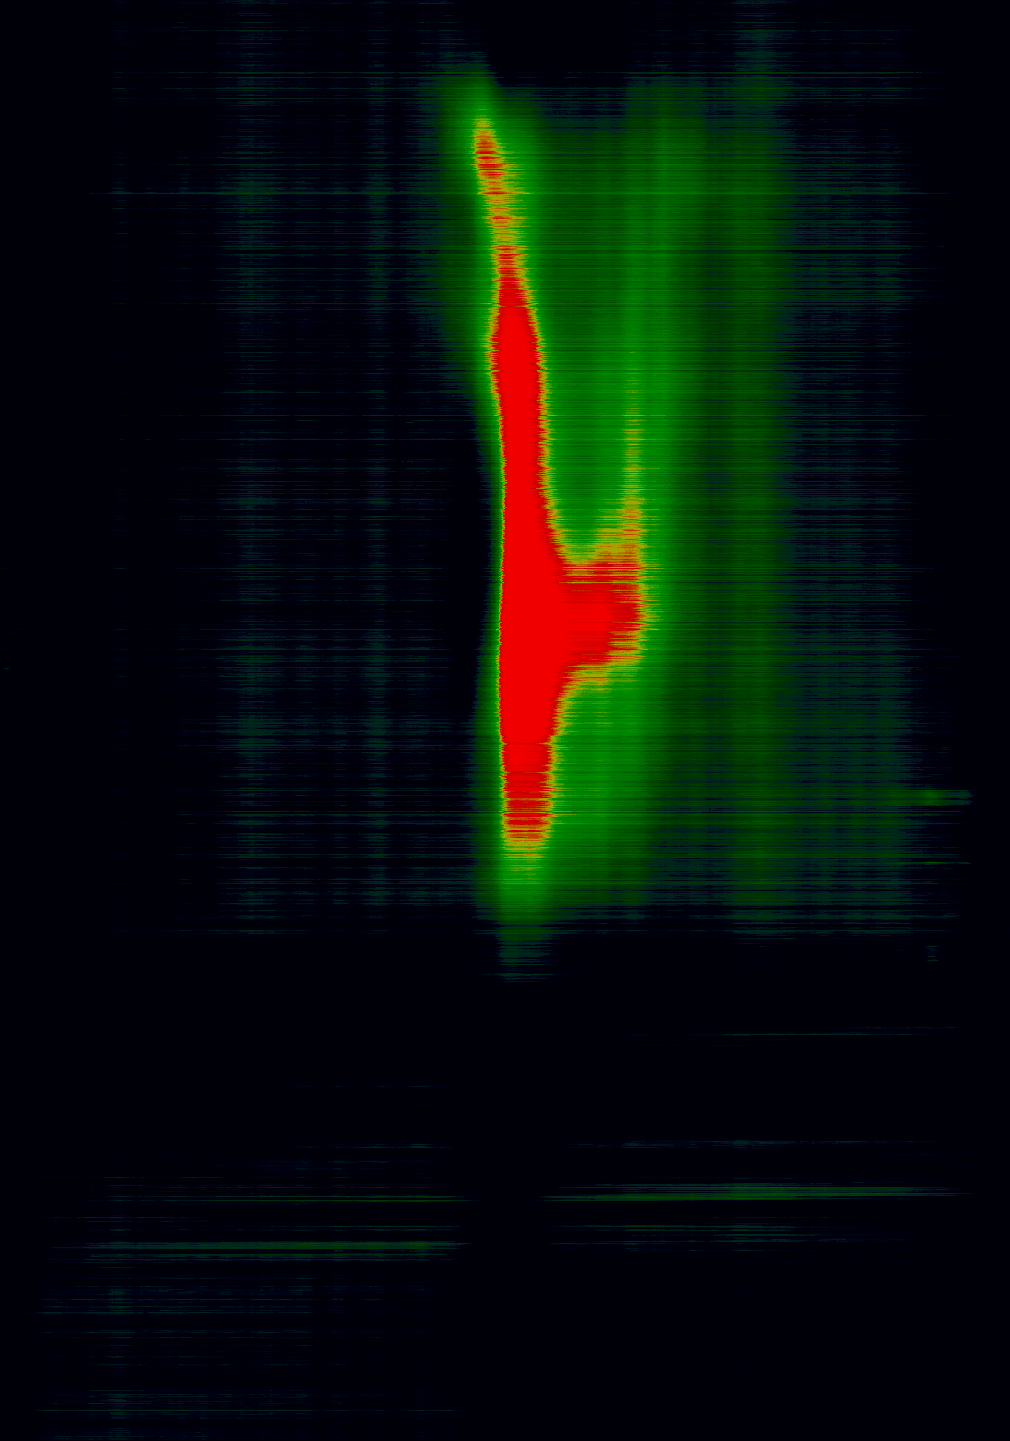
By pointing the telescope straight up at the sky (zenith) we can collect data over a 24-hour period and scan a small segment of the sky as the earth rotates. This is called drift-scanning and is the lowest effort way to collect data using a telescope.
On the 27th of August I finally had the right combination of time, weather and determination to set everything up in a secure location and started collecting the data.
As you can see from the above gif, there is a clear signal detected as the galactic plane drifts over the telescope in the early hours of the morning. With two clear peaks as the constellation Perseus crosses over.
See: Perseus Arm
This is very clear on the spectrum plot covering the whole 24 hours:
Verifying the Data
After gathering all of this data I really wanted to verify that everything was working.
For that I used the Hi Profile Search to look up reference HI profiles from the Leiden/Argentine/Bonn (LAB) survey.
First I had to convert my data from observed frequencies to observed radial velocities:
$$ V = \frac{F_e - F_o}{F_e} \cdot C $$
For comparison, we also need to account for the effective beamsize FWHM of the telescope, which is ~13 degrees (technically pyramid horns have different beam widths in each dimension, but it’s not worth worrying about right now.)
13 degrees is quite large which means my telescope can’t resolve details that are smaller. To make matters slightly worse the 2 minutes integration time translates to another 0.5 degrees (or 30 arcminutes) of resolution lost.
As such th effective beamsize of my telescope is probably (at best) 14 degrees or 840 arcminutes (or 50400 seconds of arc).
For comparison the LAB survey combined two telescopes (30m and 25m diameters) to get a combined resolution of 2160 arcseconds (0.6 degrees)
On final limitation, my current sampling is limited to 2Khz buckets which translates to 0.42km/s resolution of radial velocities. While that not might seem like much, over the long averages that we do, this will cause small differences to coalesce into larger blobs rather than distinct peaks.
Which is a long way of saying that my telescope can only resolve large features in the sky.
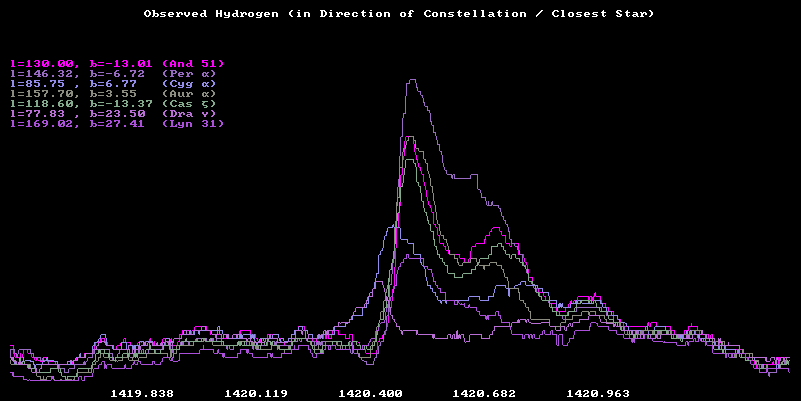
Nevertheless, when we plug in the galactic coordinates of some observations and set the effective beam size to 14 degrees we can see that details line up:
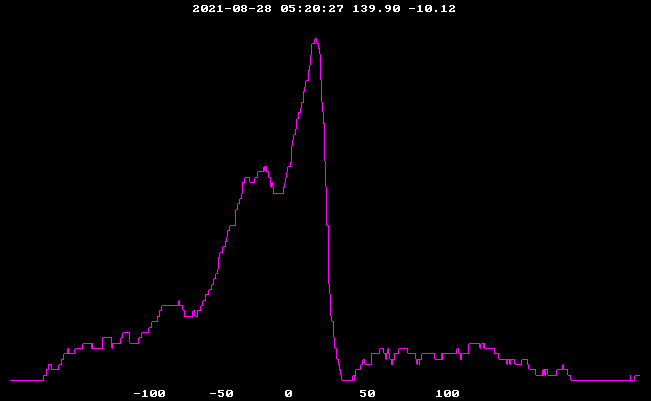
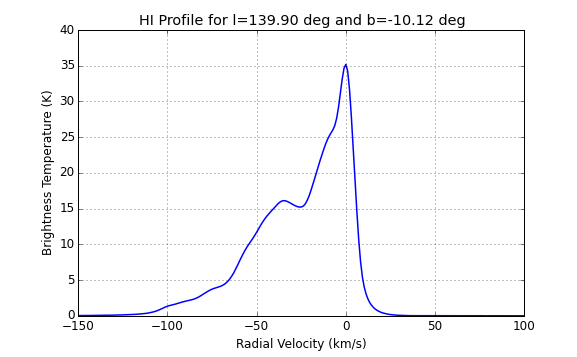
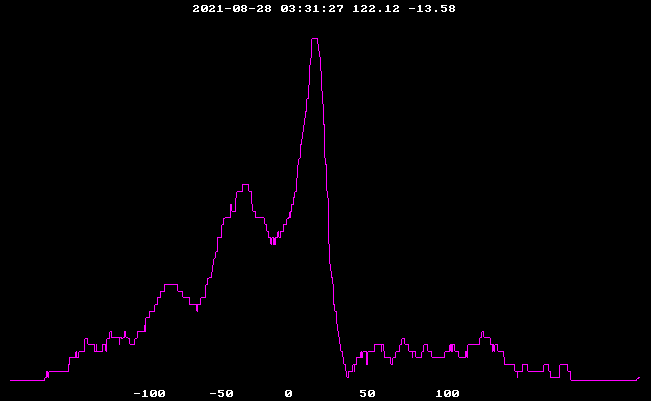
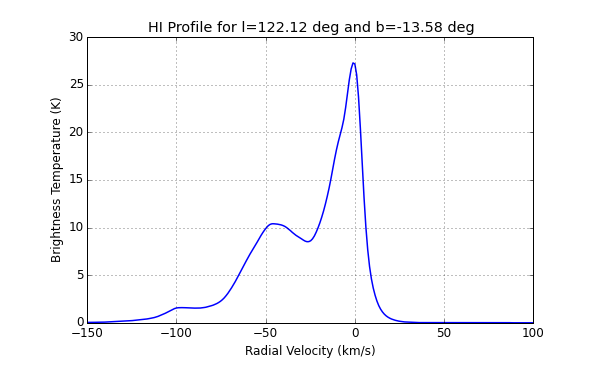
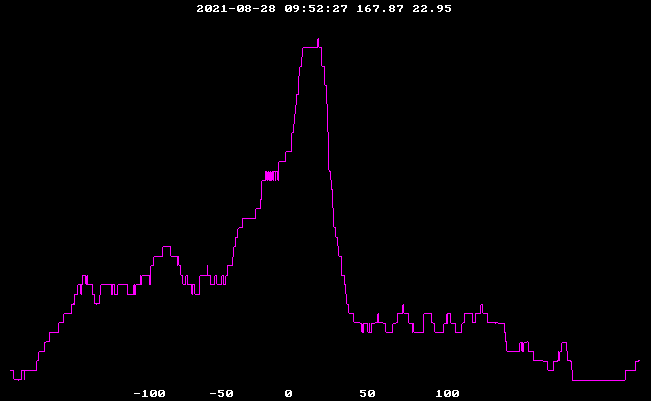
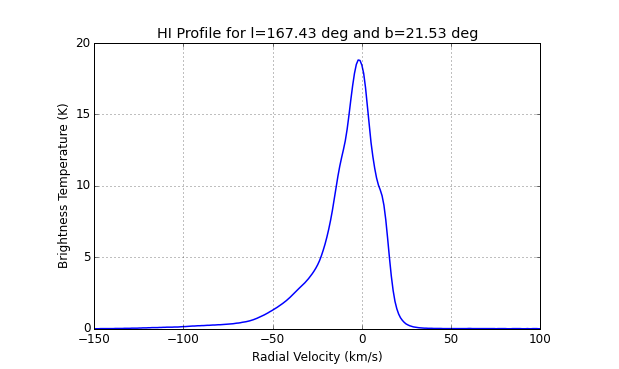
I did it! I detected galactic hydrogen, and observed multiple arms of our galaxy, all with a homemade radio telescope! Even with all the limitations I still think this is one of the most amazing projects I’ve ever worked on!
What Next?
Primarily more measurements! Everything up until this point was really just proving that the telescope worked, now we get the fun of actually using it.
This, of course, comes with more complications. As of right now the telescope is very static and designed to only stand upright comfortably. In order to look at more than a single stand of the sky I will need to build a more robust frame to allow movement while also preserving the stability of the connected receiving system.
The ability to capture more than what drifts directly overhead will allow me to replicate the measurements necessary to recalculate part of the galactic rotation curve.
I’ve already mentioned that there are improvements that can be made
to the receiving setup on the Raspberry Pi, replacing
rtl_power with a more refined and tailored approach.
My post-processing software is also in need of clean up and improvement to take it come a collection of scripts to a proper system. With that comes the ability to add more features, and more data analysis.
General Resources and Other Telescopes
There has never been a better time to get into amateur radio astronomy, and there is a small community of people who publish guides and software to dive into:
- Welcome to . . . The Astronomy Zone! In Which Two Dungeons & Dragons Nerds Build a Hydrogen Line Radio Telescope
- Observing the radio sky with PICTOR
If you plan to embark on your own telescope adventure and have questions or tips please feel free to get in touch.